
According to the Nationwide House Price Index[i], the price of the average UK house soared by 13.4% year-on-year in June (chart of the month), the largest increase witnessed in over 17 years – since November 2004. Obviously, there is a strong base-effect distorting this reading because in June last year prices had collapsed in the aftermath of the first lockdown. There is also the stamp-duty factor contributing to the strength of the housing market due to many buyers rushing to complete on their deals before the end of the stamp-duty holiday on 30 June, a measure that translated into a £15,000 saving for those purchasing homes above the £500,000 threshold[ii]. However, despite those mentioned factors, the market has continued to show significant momentum over the past few months and an increasing number of buyers are reportedly paying over the asking price[iii]. The average UK house price has now soared by almost £30,000 over the past twelve months and by nearly £15,000 in the year-to-date.
Chart of the month: Monthly UK house price, annual % change
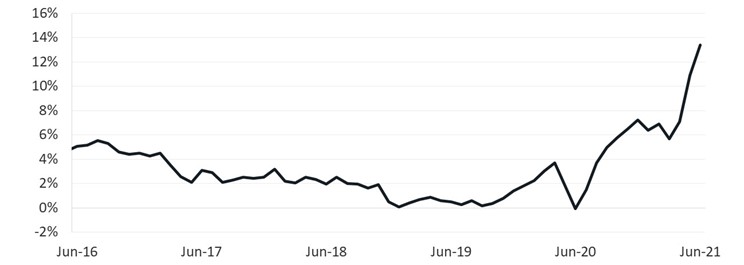
Source: Nationwide House Price Index, Blend Network
Market Commentary
- Looking at the monthly trends, June saw the third consecutive month-on-month rise (0.7%), after taking account of seasonal effects[iv]. Prices in June were almost 5% higher than in March. That being said, the month-on-month growth has clearly started to ease over the past few months (2.3% in April, 1.8% in May and 0.7% in June).
- According to the Nationwide House Price Index[v], average UK house prices rose by 10.3% year-on-year in Q2, but the reading also shows a wide divergence between different regions. Northern Ireland, by far the best-performing region, saw average house prices increase by 14% year-on-year, while on the other end of the spectrum Scotland saw average house prices increase by 7.1% year-on-year. Figure 1 shows the relative performance of some UK regions since 2015, whereas we can see, Northern Ireland has seen a very strong performance, closely followed by the West Midlands.
- In its latest affordability estimates[vi], the data published by Nationwide suggests that despite the increase in house prices to new all-time highs, the typical mortgage payment is not high by historic standards compared to take home pay, largely because mortgage rates remain close to all-time lows. However, according to Nationwide house prices are close to a record high relative to average incomes. This is important because it makes it even harder for prospective first time buyers to raise deposits.
Figure 1: UK regional house price (index Q1 2015=100)

Source: Nationwide House Price Index, HMRC, Blend Network
Register as a lender or a borrower at www.blendnetwork.com to make sure you don’t miss the latest property market news, updates and exclusive information.
Data found in this article are the property of the sourced information. Whilst every effort has been made to ensure this data is correct, Blend Network cannot guarantee there are no errors in the sourced data.
Your capital is at risk if you lend to businesses. P2P lending is not covered by the Financial Services Compensation Scheme. Investments are illiquid (the inability to sell assets quickly or without substantial loss in value). Past performance is not a reliable indicator of future results.
BLEND Loan Network Limited is authorised and regulated by the Financial Conduct Authority (Reg No: 913456).
[i] Source: www.nationwide.co.uk/about/house-price-index/headlines#tab:Headlines
[iii] Source: www.estateagenttoday.co.uk/breaking-news/2021/6/ever-more-buyers-paying-over-the-asking-price-for-properties
[iv] Source: www.nationwide.co.uk/-/media/MainSite/documents/about/house-price-index/2021/Jun_Q2_2021.pdf
[v] Source: www.nationwide.co.uk/about/house-price-index/headlines#tab:Headlines
[vi] Source: www.nationwide.co.uk/about/house-price-index/download-data#xtab:affordability-benchmarks
