
While UK house prices continued to advance in April, the pace of growth slowed modestly. According to the Nationwide House Price Index, average prices advanced by 12.1% YoY, slightly down from the 18-year high of 14.3% seen in March[i]. That said, this was the 11th time in the past 12 months that the annual growth rate has been in double digits. Prices were pretty much flat in April compared to March, increasing by just 0.3% – the weakest monthly increase since September last year. Meanwhile, Rightmove reports that the pace of price rises has begun to tail off slightly as affordability constraints and economic headwinds combine[ii]. Indeed, earlier this month the Bank of England warned that UK GDP growth is expected to slow sharply in the coming financial quarters and that inflation may rise above 10% this year.
Chart of the month: Monthly UK house price, annual % change
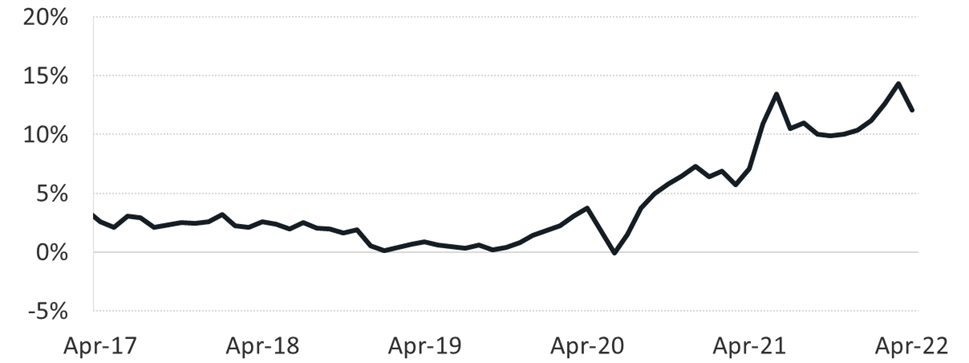
Source: Nationwide House Price Index, Blend Network
Market Commentary
- According to several indicators, the housing market frenzy of the past two years has settled into a more manageable, steady environment. The Nationwide House Price Index was pretty much flat in April[iii], and the Rightmove House Price Index also reveals some early signs of an easing off from the recent frenetic pace of price rises – buyer enquiries to agents are reportedly down by 16% on last year’s stamp-duty frenzy[iv].
- The signs of an easing property market are also consistent with the May OnTheMarket (OTM) Property Sentiment Index[v]. The report – released this week – found that while the high levels of buyer and seller confidence in April are consistent with the previous two months, there is also strong evidence emerging of a more stable housing market.
- Despite the softening housing market conditions, frenetic activity continues. Indeed, a survey of c3,000 consumers across the UK conducted by Nationwide this month revealed that 38% of respondents were actively moving or considering move – very high, given that only c5% of the housing stock turns over in a typical year in the UK[vi].
- As a further indicator that activity remains strong, Rightmove reports that the average time to sell a property has halved from 67 days in Q2 2019 to just 33 days currently[vii].
- The interest rate rise -and the prospect of more to come – has certainly contributed to greater caution among prospective house buyers and a rush to fix their interest rate among the reported 1 million UK borrowers on a standard variable rate mortgage[viii].
- The sharp price increase since the pandemic has aggravated the affordability crisis. According to Nationwide, around 45% of local authorities now have a house price to earnings ratio (HPER) of 6+, compared with c35% in 2016, and a 20% deposit is equivalent to 110% average income – a record high and up from 102% one year ago[ix].
Property Market News
- A piece in the Daily Telegraph earlier this month warned that the holiday let property market was about to collapse with the end of the staycation boom as tourists start to look abroad, a surplus of properties hits and councils turn on investors: Read more.
- While a price slowdown is widely expected, and indeed has already started to emerge, the extent of it is disputed. Capital Economics expects a 5% drop over the next two years, reversing a fifth of the rise since the pandemic began. They expect London and the Southeast to see the largest drop in prices and the north and Wales the smallest[x].
- The increase in interest rates has already started to feed through to mortgage rates. While they remain low in historic terms, mortgage interest rates have edged up further in recent weeks. The FT reports that NatWest, Yorkshire Bank, Clydesdale Bank, Metro Bank and Newcastle Building Society have already raised rates on selected mortgage products[xi].
Figure 1: Affordability Indicator (price to earnings ratios)
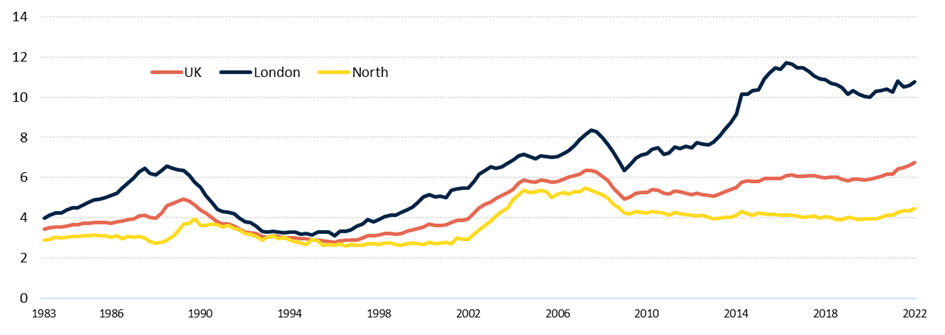
Source: Nationwide House Price Index, Blend Network
Register as a lender or a borrower at www.blendnetwork.com to make sure you don’t miss the latest property market news, updates and exclusive information.
Data found in this article are the property of the sourced information. Whilst every effort has been made to ensure this data is correct, Blend Network cannot guarantee there are no errors in the sourced data.
Your capital is at risk and lending through an electronic platform is not covered by the Financial Services Compensation Scheme.
Past performance is not an indicator of future returns.
BLEND Loan Network Limited is authorised and regulated by the Financial Conduct Authority (Reg No: 913456).
[i] Source: Nationwide House Price Index, https://bit.ly/3wP4U8H
[ii] Source: Rightmove House Price Index, https://bit.ly/3Pqwy3Y
[iii] Source: Nationwide House Price Index, https://bit.ly/3wP4U8H
[iv] Source: Rightmove House Price Index, https://bit.ly/3Pqwy3Y
[v] Source: On The Market (OTM), https://bit.ly/3Lw7q9b
[vi] Source: Nationwide House Price Index, https://bit.ly/3wP4U8H
[vii] Source: Rightmove House Price Index, https://bit.ly/3Pqwy3Y
[viii] Source: https://bit.ly/3Nj2GFa
[ix] Source: Nationwide Affordability Special Report, https://bit.ly/3lcHrsz
[x] Source: Bloomberg, https://bloom.bg/39pCpq2
[xi] Source: FT, https://on.ft.com/3lxbD1P
